
(Mostly) Useful Government Numbers About Poverty, Jobs, and Unemployment, Including the Latest Employment Report for February 2024


Census Bureau
While government statistics offer some useful insight into jobs, employment and poverty, they also miss a lot, and can underestimate poverty and unemployment levels.
by Frank Stricker
A Failed Number
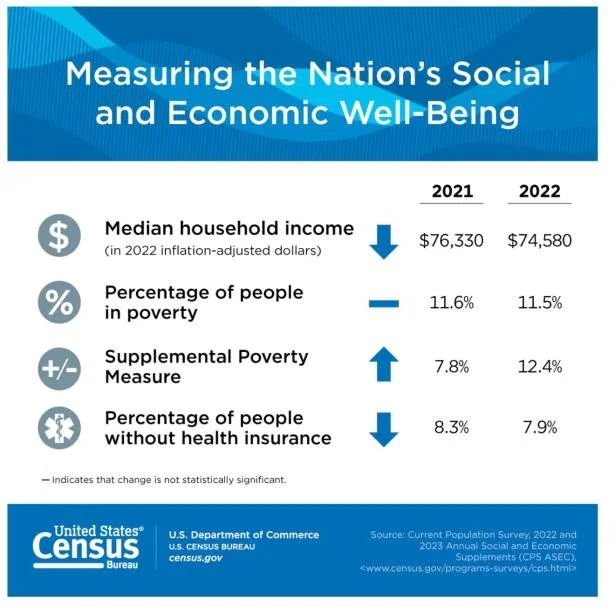
Does the Federal Government regularly publish estimates of what a reasonably comfortable living standard would be for an average household? There must be something somewhere. A government agency does publish poverty lines–aka, poverty thresholds–and its experts tell us how many people fall below the lines. In spring, the Census Bureau gathers income and other information on the preceding year and publishes the results in September. The last report was Poverty in the United States: 2022.
According to this publication the proportion of the population that was poor in 2022 was 11.5%. That is the poverty rate. There are rates for many categories, including ethnic groups and households with no workers. Recently the Bureau created Supplementary Poverty Measures (SPM) which offer more information than the official poverty rate. But the SPM poverty rate was just 12.4%, so it does not change the basics, and it has not incentivized me to master the details of the SPM. The big picture for me is that each poverty measure is totally inadequate, especially in a country that is overflowing with riches. The poverty lines are given on page 18 of the 2022 report. The line for a family of four with two young children was $29,678. The line for singletons 65 or older was $14,036. Think about those numbers for half a minute. A family of four with $30,000 a year was not officially poor in 2022.
By this reckoning, a $15 an hour job for 2000 hours a year puts a family over the poverty line. And $25 an hour for 40 hours every single week is heaven: $52,000, before Social Security and other deductions. In reality, even that isn’t heaven for a family of four. Isn’t it clear? We need new poverty lines that reflect economic realities, one of which is that living standards and the total wealth of the nation have zoomed upward since the lines were first developed in the 1960s.
Real Earnings is Real Useful
More useful than current poverty lines is the Bureau of Labor Statistics (BLS) monthly report whose title is Real Earnings. This short publication covers all non-farm private-sector employees and includes a subset of information on production and non-supervisory workers, i.e., a more working-class group than that of all employees. In this publication you will find bar graphs and tables on changes in real pay—that is, with the effects of inflation removed. For example, in January of 2024 hourly pay checks looked like they had increased by 4.8% from January of 2023, but after inflation, the real purchasing power of the average wage grew by just 1.8%. Nothing to write home about. Yet that was better than the previous January-to-January change in real earnings which was -0.9%.
In this publication you will find numbers on various aspects of earnings and a Consumer Price Index which shows many things, including that prices rose by 6.2% between January 2022 and January 2023, but only 2.9% the following year. However, if you want to do a lot of work with prices and on an array of items, you should use the monthly BLS publication called Consumer Price Index.
Labor Flows
An underused batch of statistics that provides a surprising conclusion has to do with labor flows. Where do most people who find jobs in a particular month come from? Well, they must have been unemployed in one month and employed in the next, right? Turns out that is not quite right. Of 6 million newly employed workers in January 2024, most of them were not searching for work in the previous month, that is, they were not taking at least one of what the BLS defines as active job-search efforts, such as contacting an employer about a job or seeking assistance from friends and relatives about job leads. So they weren’t “unemployed.”
In January 2024, of all newly employed persons only 1.3 million had been officially unemployed in December. But 4.7 million had not been in the labor force—i.e., neither working nor looking for work in approved ways, but they found jobs.
Why are these things useful information? Because they give support to the idea that the population of job-wanters and needers is always much larger than the people who are actively searching for work. There are always millions of people out there who are essentially unemployed and who are on the lookout for good job opportunities but are not counted as unemployed. Many of them eventually find jobs.
The population of job-seekers is always much greater than the BLS’s unemployed population. It is closer to National Jobs for All Network’s (NJFAN) Full Count which adds part-timers who want full-time work and people who say they want jobs but have not searched recently. A big conclusion from all this information is that even when the official unemployment rate is 4% or 3.6%, we are not close to full employment, although many of our leaders and experts think we are.
Frank Stricker is on the board of the National Jobs for All Network. He wrote Why America Lost the War on Poverty (2007) and American Unemployment: Past, Present, and Future (2020). He is emeritus professor of history and labor studies at Cal State University, Dominguez Hills.